MISR Regional GoMACCS Imagery Overview |
 |
MISR Regional Imagery: Overview | Products | Data Quality | Map Projection | File Format | View Data | Download Data
 About this Web Site: About this Web Site:
Visualizations of select MISR Level 3 data for special regional parameters are available from this interface. The Regional products are derived from averaging select Level 1 and Level 2 parameters over daily, monthly, seasonal and annual time periods. The products described here are a special regional version used in support of the GoMACCS Campaign. More information about the Level 1 and Level 2 products subsetted for the GoMACCS campaign is available on the GoMACCS Data Table. More information about the general MISR data products and how to obtain them is available from MISR Data and Information. |
||||||||||
| About the Data:
The MISR Regional data products are reported on a rectangular grid at either 1.5 km or 24 km resolution (depending on the parameter) in a Lambert Azimuthal Equal Area map projection. Detailed information is available on the Map Projection page. Select variances and covariances are also reported at a coarser resolution of 24 km, but no images of variances/covariances are available. All MISR data products are in HDF-EOS format. Detailed information about the products visualized is available, as well as the File Format of the HDF-EOS files. |
||||||||||
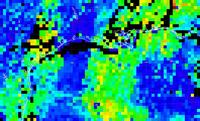
About the Images: Images in JPEG format show parameters averaged over daily, monthly, or seasonal time periods. The seasons are named for the season in the northern hemisphere (see the table at right). By design, the images show data for a fixed geographical region, with a fixed color table. This allows images from different days to be directly compared. However, this has the disadvantage that it might clip data which has a portion outside of the geographic range, and doesn't select the color table to best display the dynamic range of a particular day. The images on the Daily Imagery page make the opposite compromise, all of the data is shown and the color table is picked to best display the dynamic range (but you can't directly compare different days). Because of the large data volume required for daily Regional data, daily data for the GoMACCS campaign period are available only for August/September 2006. During this period MISR has one or two overflight a day of the GoMACCS campaign region. Images can be animated through each month of a year by selecting the "Animation" button or "Animate through year" in the Month/Season selection. By default, the animation runs through the seasonal year (December - November), but the "Advanced Options" can be selected to modify this. Similarly, you can animate through the days of a month by selecting the "Animation" button while looking at a daily product or "Animate" in the Day selection. For radiance data, images can also be animated through the nine MISR views by selecting the "Animate" tab. |
||||||||||
| Acquiring MISR Regional Products
The MISR data product that the images were generated from can be downloaded. To do this, select the "Download" button. In addition, data can be downloaded directly from the data pool. Before you use the MISR Regional products, you should read about the Data Quality. |